
What the Derivatives Are Saying
Feb-March Commentary
The bear market that followed the crypto market peaked in early October 2025 has been swift and deep. BTC is approximately 44% below its peak of $126,080 and ETH about 56% below its peak of $4,946. However, many metrics point to a bottom forming in BTC in its current range of $60,000 to $70,000.
Price and spot markets are only part of the picture
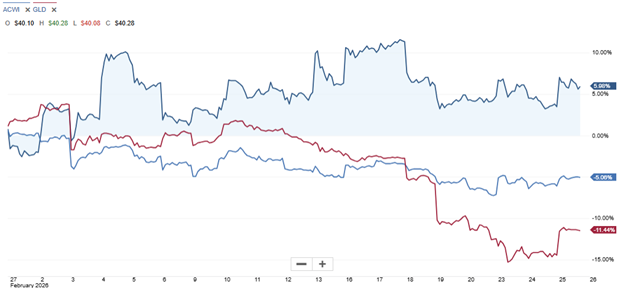
Risk asset ETF price behaviours post 28-Feb-2026. IBIT (iShares BTC Trust) is dark blue, ACWI (iShares MSCI ACWI , i.e., global equities) is light blue, and GLD (SPDR Gold Trust) is red. Source: Schwab.
After the start of the US-Israel Iran War on February 28, both gold and global equities have sold off by approximately -11% and -5% respectively. Meanwhile BTC prices have held up surprisingly well, gaining close to +6%. Of course, this must be placed in a proper context against a longer timeframe to get a fuller picture.
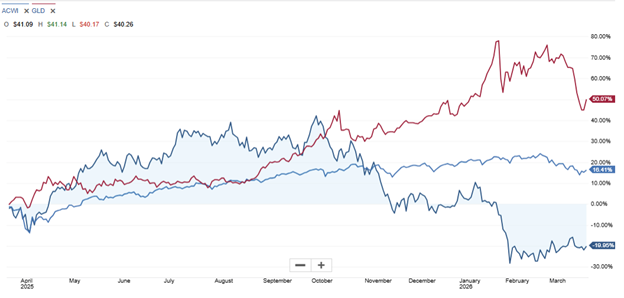
Risk asset ETF price behaviours since March 2025. IBIT is dark blue, ACWI is light blue, and GLD is red. Source: Schwab.
If we treat BTC, equities, and gold all as risk assets, and squint at their performance over the past 12 months, it almost seems as if the BTC peak was a frontrunner to the peak of the other two risk assets. It’s as if over the past month, the relative strength of the BTC performance was due to “sell exhaustion” relative to equities and gold rather than actual demand. Can we get a better understanding of BTC’s recent relative strength?
What the derivatives markets are saying
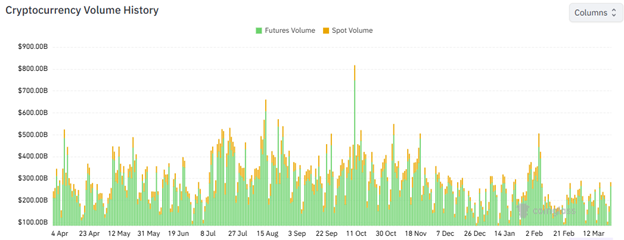
Crypto market spot and futures volumes over the past 12 months. Source: Coinglass.
Price action is the consolidation of many agents and there are other ways to peer at the supply-demand balance. Furthermore, spot volume is a fraction of derivative trading volume. For example, over the the 24 hours ending 24-Mar-2026, spot volume for BTC was just under $40 billion according to Coingecko, while futures over $71 billion according to Coinglass, or around a 1:1.75 ratio. This ratio varies widely across coins and across time. For the broader market a ratio reaching 1:10 spot/futures volume is not uncommon, as evidenced in the chart above.
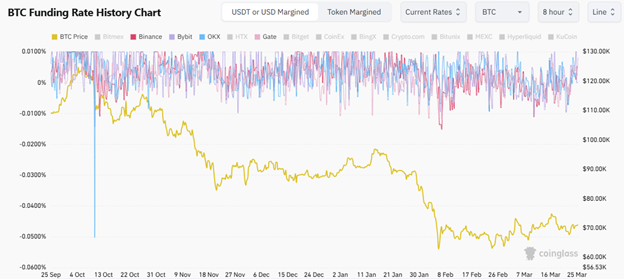
Perp funding rates at major centralized exchanges over the past 6 months. Source: Coinglass, Coinperps.
Perpetual futures (or “perps”) are an innovative instrument embraced by the DeFi and CeFi exchanges for digital assets. Unlike most dated futures that trade on TradFi exchanges, say gold futures on the CME, perps have no maturity. To balance the supply and demand of traders who take long versus short positions, exchanges, such as Binance, charge a funding rate. The funding rate is quoted as a fee over an 8-hour time window (quote specifications can vary by exchanges). Positive funding rates indicate that the initiator of a long contract pays a funding rate to entice short sellers. Similarly, negative funding indicates an imbalance to the short side to entice long buyers. Over the month of March, the perp funding rates for BTC have hovered around 0%, suggesting that while the perp volume has been active, there’s been a balance across the long and short books. More recently in the last week of March, there’s been a slight imbalance to the long side as the perp funding rate has crept up to 0.005% (i.e., for 8 hours, equivalent to approximately 5.5% per annum). Overall, the perp market is suggesting that the market is still cautious of recent price gains.
The options markets provide a richer information set.
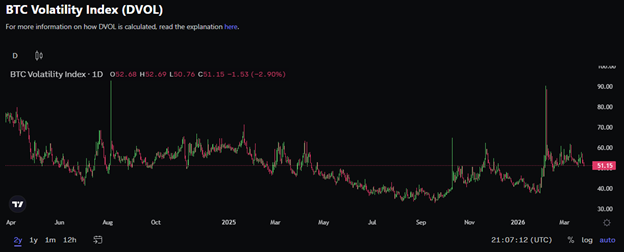
Deribit’s DVOL over the past 2 years. Source: Deribit.
The Deribit exchange provides active options trading in BTC, ETH and other tokens. Quite importantly, it also provides insightful metrics. The exchange calculates a BTC Volatility Index (DVOL) that is a metric of expected volatility of BTC prices based on its options market. This index has recently “normalized” around 50% per annum from its lows in the summer of 2025 and after a brief spike up to around 90% in early February 2026 when BTC dropped to its recent lows below $64,000.
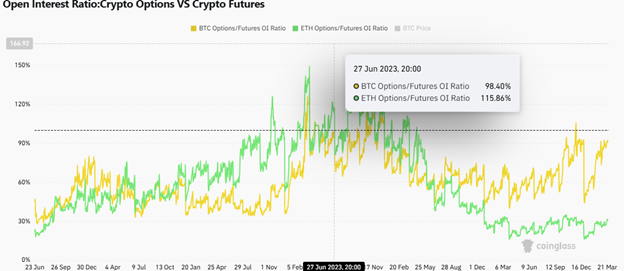
Crypto options to futures open interest. Source: Coinglass.
The DVOL index provides an incomplete picture. Since options provide a non-linear payoff to price moves, these instruments allow traders to engineer price points to shed or take on more risk in their portfolios. The open interest in options, compared to the futures, has recently reached levels last seen in 2023. This suggests that although the DVOL has “normalized”, traders remain quite uncertain about future price direction and are turning more to options for portfolio structuring.
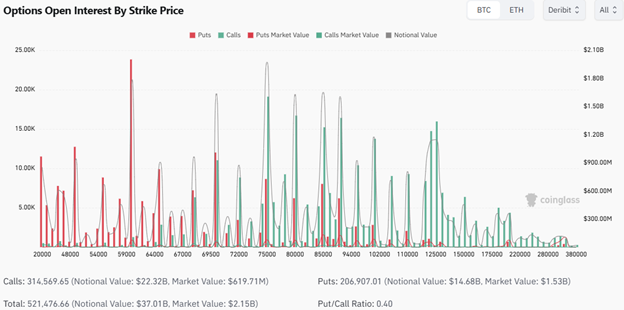
BTC options open interest by strike price. Source: Coinglass, Deribit.
A snapshot of the current BTC options’ open interest on Deribit shows that traders are quite interested in protecting their downside at a BTC price of $70,000. Interest in adding exposure on the upside is spread somewhat evenly from $75,000 to $125,000.
HODLing on
Overall, the crypto derivatives market suggests that the recent relative strength and consolidation in BTC’s price is positive but still tenuous. For the long-term investor, these analytics are interesting but ought not to be the key drivers to deciding to hold a portfolio of cryptoassets. Instead, the metrics ought to be more fundamentally based on adoption, application, and protocol enhancements. We’ve discussed many of these, but it may be worthwhile providing an update on the US CLARITY Act. Progress on this bill has been contentious between the crypto and the banking industries. After passing the House in July 2025, discussions between the two industries remain stuck in the Senate since mid-January 2026. The main issues at the heart of the debate are the ability for stablecoin issuers to provide yield to its holders, the jurisdictional oversight between the SEC and the CFTC, and the tradeoff of consumer privacy versus AML obligations. [1, 2]
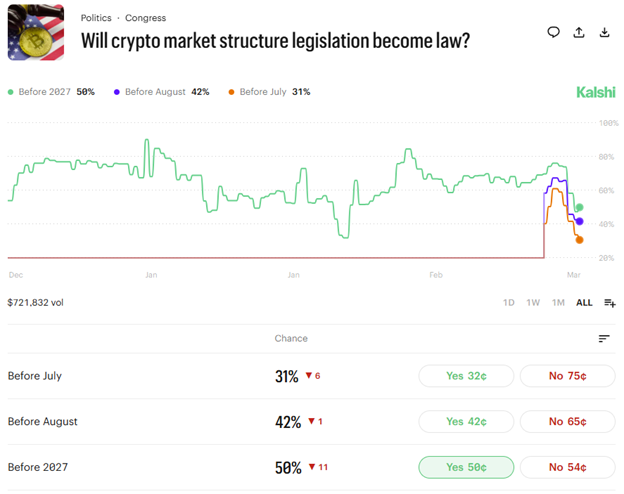
Expectations of the CLARITY Act becoming law. Source: Kalshi.
According to the predictions market, the expectation of the CLARITY Act becoming law in 2026 is priced at even odds.
Long-term HODLers of cryptoassets have been through bear markets before. We’ve laid out and reviewed our investment thesis. Proper risk sizing in a portfolio will help us weather through a bear market. This is just another cycle.