
Tariff Thy Neighbor
March 2025 Commentary
President Trump announced his much-awaited tariff policies after the US market hours on Wednesday April 2, Liberation Day. With investors already jittery from the previous on-again, off-again tariff pronouncements, it had the effect of releasing a trampling bear onto the markets – cryptoassets and equities alike.

Source: CNN
President Trump announced a blanket 10% minimum tariff across the board on imports to the US from almost all countries, and imposed heavier penalties on select countries such as China of 34%, EU 20%, and Japan 24%. Much has been covered by major news outlets including CNN and NPR.
Deep Fear
Global equities reacted immediately upon the market open on Thursday morning. Over the next two days, the S&P 500 dropped to post -10.5%, the Nasdaq Composite -11.4%, the Euro Stoxx 50 -8.0%, and the Shanghai Composite -6.6%. These two-day returns were among the worst that had ever been experienced in the modern history of the equity markets, ~ 0.04% of the occurrences to be exact, and rank in infamy along with the following events:

Worst 2-day returns for the S&P 500 since 1975.
Source: Yahoo Finance, Firinne Capital
VIX, a market volatility indicator calculated by the Chicago Board of Options Exchange which had been hovering around 20 over the past month, jumped to 45 by the close of business on Friday. For all the President’s promise of reshoring and reemergence of US manufacturing, the markets did not seem to agree. Admittedly, two days is too short of a time window to gauge how the impact of tariffs on the economy may play out over several years to come.

Source: CBOE
Over in the digital assets market, quality tokens held up surprisingly well. Over the same two days, BTC actually gained 1.6% and ETH +1.1%. However, this belies the fact that a cap weighting of the top tokens listed in the Bitwise 10 Large Cap Crypto Index had already fallen by about 18% over the first quarter – anchored by BTC posting only a -12% loss, while ETH posted -45%, SOL -35%. Meme coins were the big losers, with the median of the lot likely losing 99% of their value, given the millions that are in circulation. CoinMarketcap’s Fear and Greed remain well entrenched in the Fear territory.
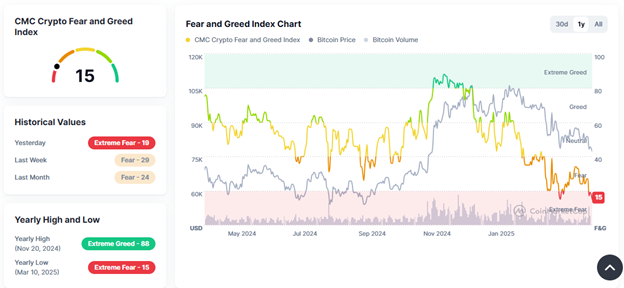
Source: CoinMarketCap
Shifting Sands of Correlations
Volatility is but one gauge of market sentiment. A shorthand for gaining a bit of a deeper insight into the investor mindset is to look at correlations of different assets and see how this compares to other periods in the past. Long-horizon asset allocators like to think about average, stable correlations but market dynamics over shorter time periods hardly exhibit that.

Historical correlations.
Source: Coingecko, Yahoo Finance, Firinne Capital
The four plots above look at the correlations of daily returns of BTC, gold, and the Nasdaq Composite over select three-month periods, covering three crises and one euphoric period. From left to right, the four three-month periods we chose to cover were,
31-Jan-2020 to 30-Apr-2020 window that straddled the global declaration of Covid pandemic,
31-Dec-2021 to 31-Mar-2022 window that culminated with the first US Fed rate hike in March 2022, in response to rising inflation brought on by the Russia-Ukraine attack-induced global supply chain shock,
31-Aug-2024 to 30-Nov-2024 window that led into the November US elections,
01-Jan-2025 – 08-Apr-2025 window that covered a bit more than the first quarter of 2025 and includes the aftermath of the tariff Liberation Day announcement.
Correlations varied significantly over these four periods. A simplifying but illustrative way to characterize these four periods may be to use the lenses of growth and inflation expectations. The characterizations look something like the following,

Source: Firinne Capital
The standout diversifier appears to be gold, while investors seem to treat BTC as a long-duration, risk asset similar to the Nasdaq Composite. While gold is not a perfect hedge against inflation and all systemic shocks, it does a decent job. In contrast, the thesis that BTC is digital gold looks weaker with the passage of time. (We will have more to say about this in a later article.) Finally, the observation that BTC had a positive but quite low of a correlation with the Nasdaq over this turbulent first quarter suggests that its role as a diversifier remains intact, although this is worth closer scrutiny for various reasons from the crypto markets trading continuously to teasing out any potential lead-lag relationships.
What’s an Investor To Do?
How an investor reacts (or not) to these times depends on the investor’s profile which incorporates her risk preferences, investment horizon, and utility from investing. A short horizon investor may want to consider possible scenarios over the next few days or months, consider potential allocations to each scenario, assign probabilities, and aggregate these different views.
The long-term investor can leverage patience and any dry powder for (re)allocation to her advantage. While tariffs have created shock and confusion, progress continues to be made in the crypto industry. Ethereum is scheduled for a major upgrade known as Pectra on May 7th. This upgrade incorporates several improvements among which include improved programmability for digital wallets, allowing for a larger staked balance for a single validator thereby streamlining operations, and increasing the blobs that can be stored per block to improve scalability. In response to the lower fees that have been ailing Ethereum, community members are proposing dynamic pricing to capture more fees for the network validators to enhance network security. Meanwhile, Congress has made meaningful progress on stablecoin legislation. Two competing bills, the GENIUS Act of 2025 and the STABLE Act of 2025 are making their way through the Senate and the House respectively as part of the US Congress’ regular legislative process.
Both investor profiles have opportunities to take advantage of current market conditions. Choose your strategies accordingly.